Integrated System
Web APP (B2C)
Senior Product Designer
UXR, UXD, UID, and Workshop Facilitator
I was responsible for design management and leading the design team. I led the end-to-end Product Design process by managing a design sprint workshop: research with stakeholders, problem mapping, insights and ideation, benchmarking, wireframes, storyboards, prototyping, user testing, analyzing data, and research insights.
Context
Ailos
It's a group of credit cooperatives with a strong presence in southern Brazil.
Some relevant topics
• Have 13 cooperatives
• Include more than 1 million members
• Include more than 230 service stations
• Are present in more than 80 municipalities
• Are present in three states
• Have more than R$ 8 billion in credit operations
• Own R$ 1 million in shareholders' equity
• Have total assets of R$ 12 billion
Credit unions gather resources and financial solutions to achieve common goals, improving the member's quality of life and helping to develop the local community.
Ailo's Challenge
Offer credit through cooperativism.
Scenario
To grow cooperatives in a sustainable way, Ailos needs an organization and a single system to carry out credit operations to members.
A year ago, the company was internally discussing how to solve this challenge.
My Challenge as a Product Designer
Facilitate sprint design, design the product and test it in a week.
Method | Co-creation
Use of co-creation methodology to:
• Understand how to get quick feedback
• Stay on the same page as the stakeholders
• Implement other ways to approach problem-solving
• Work collaboratively and encourage others to have a sense of ownership
• Develop the most complete product possible
Goal
Improve the relationship with the cooperative.
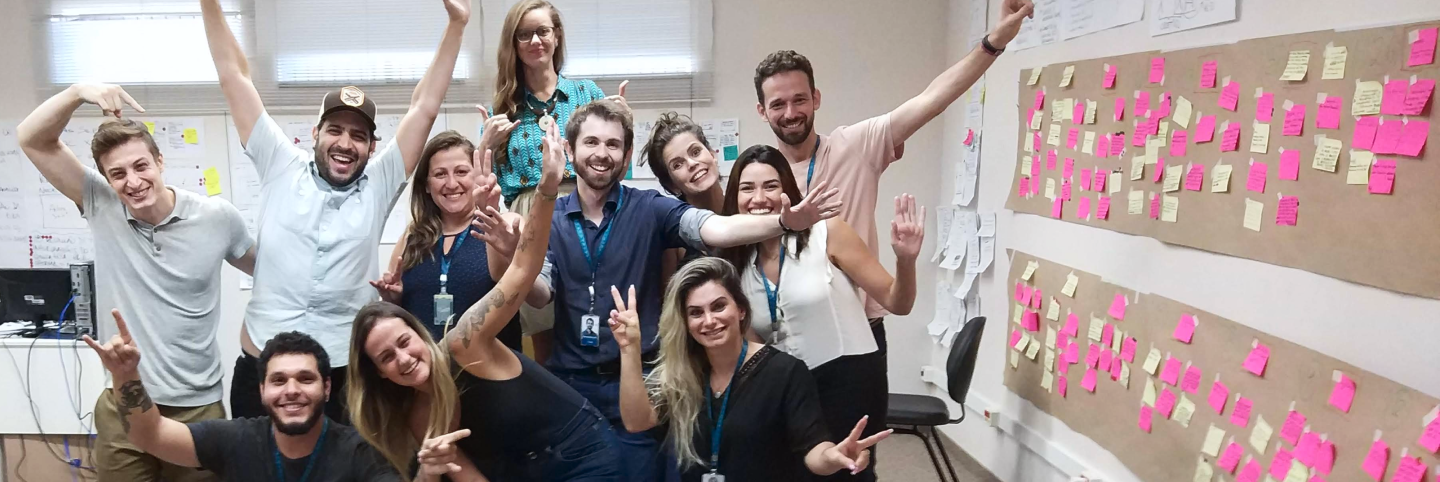
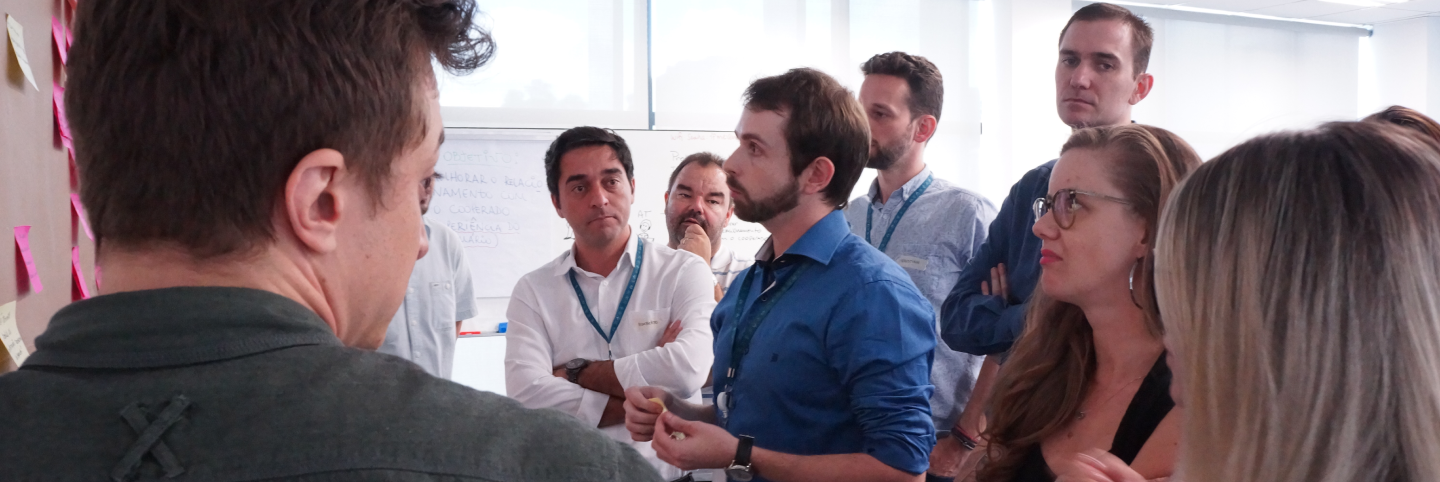
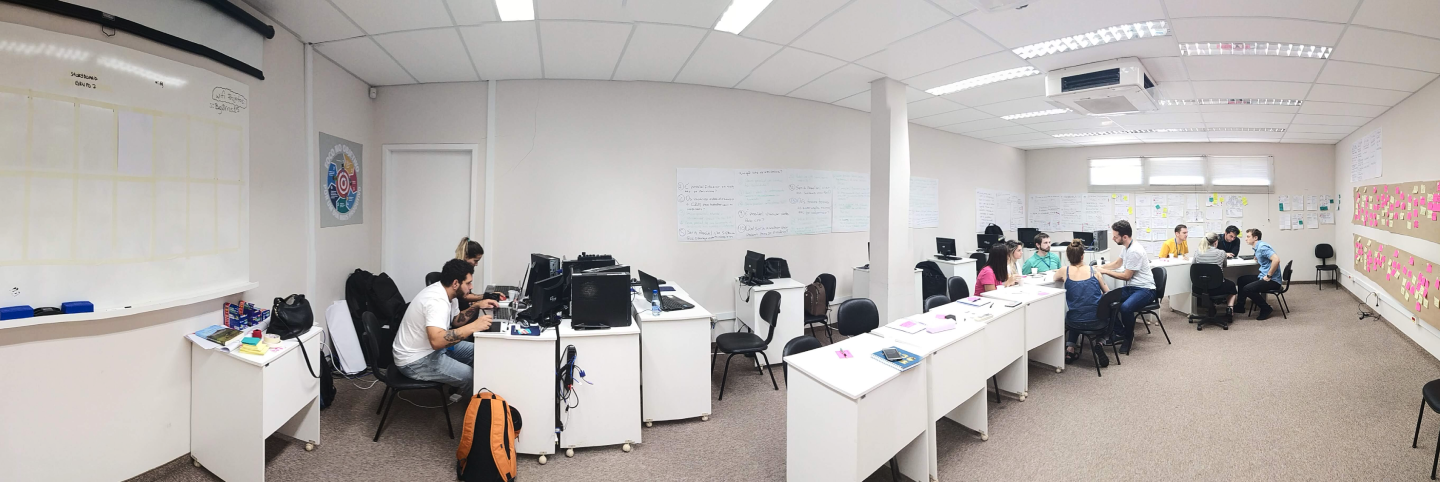
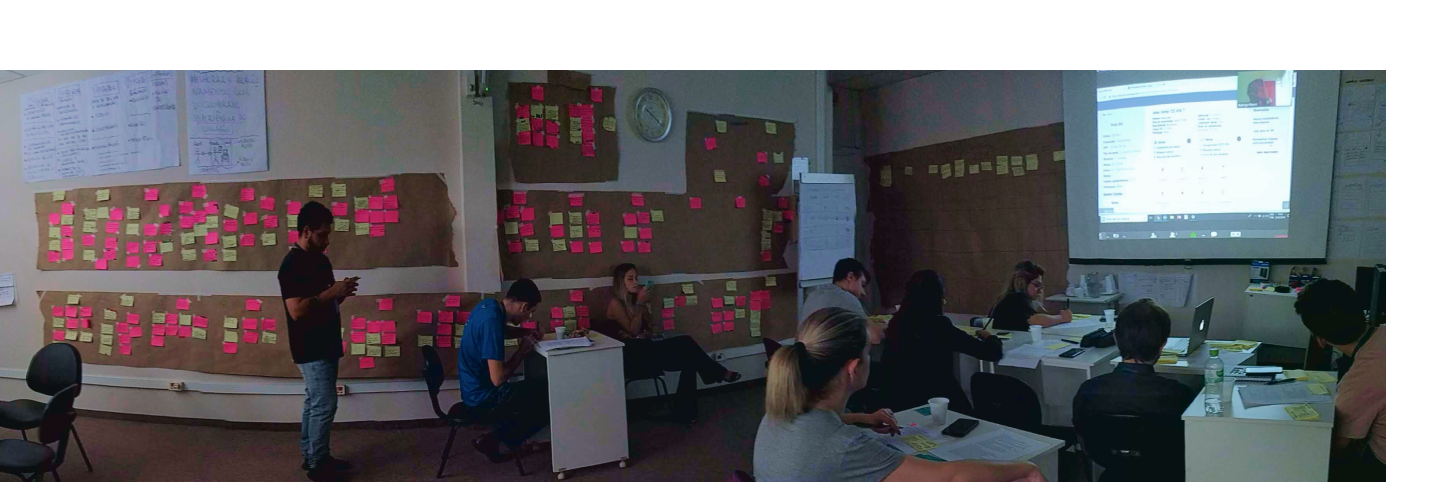
About the Design Sprint Dynamic
Total number of Ailos’ participants: 10
Total number of facilitators: 2
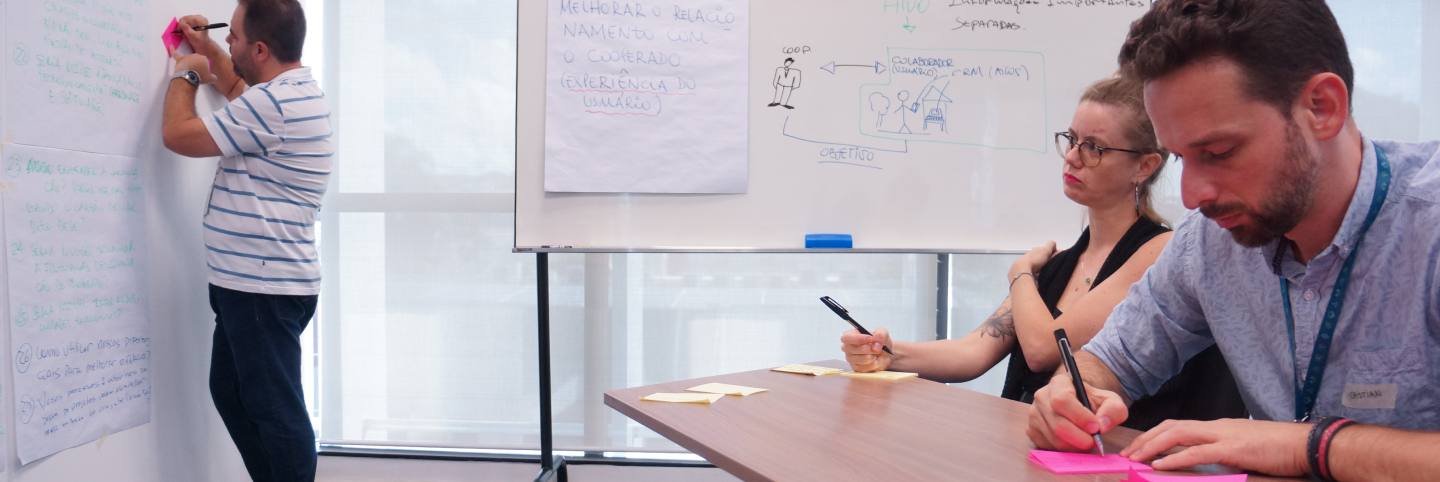
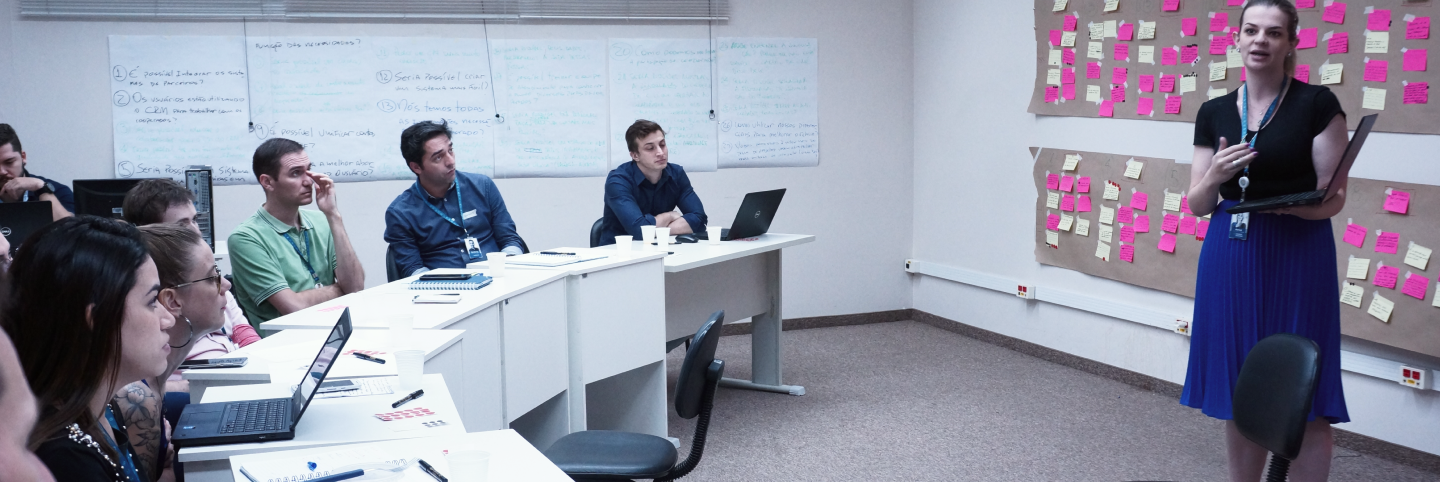
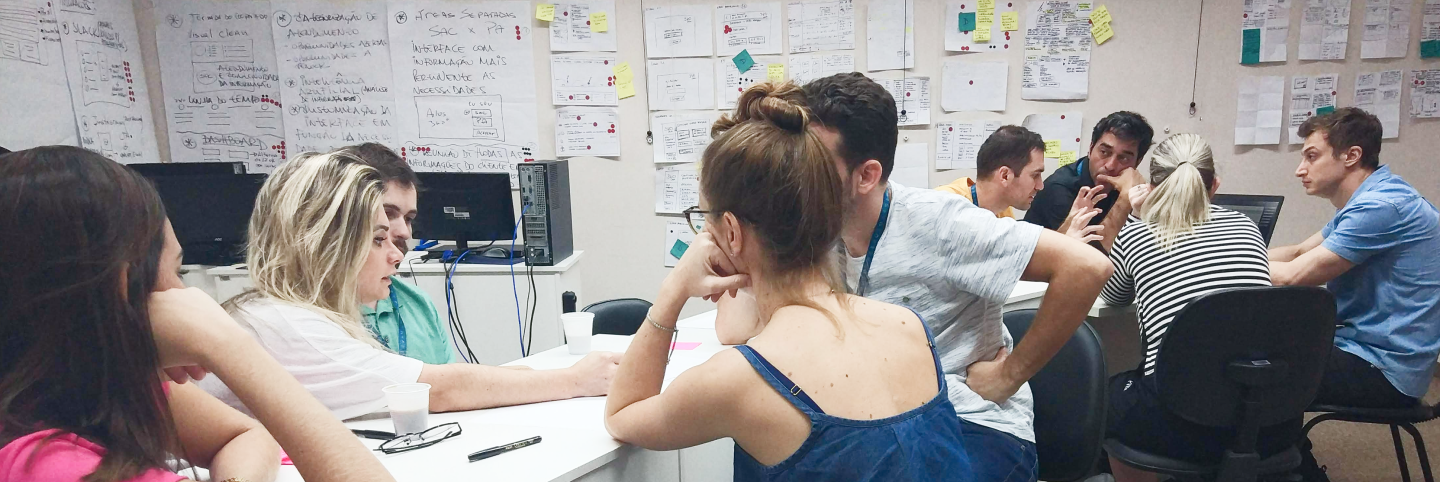
Phase 1 and 2 | Understand and Define
Mapping
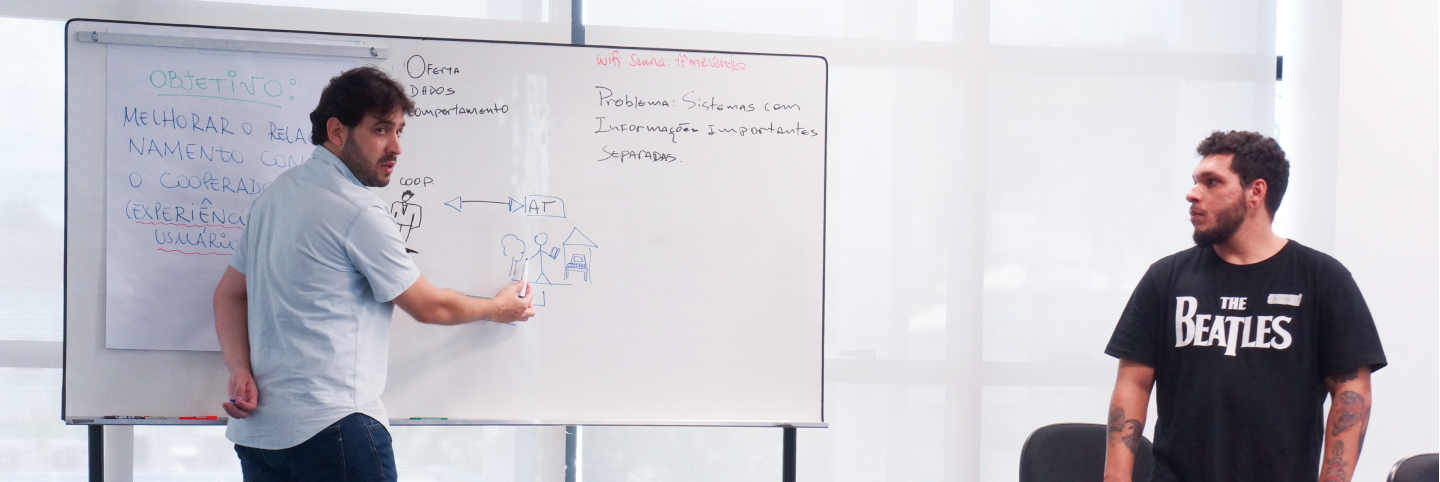
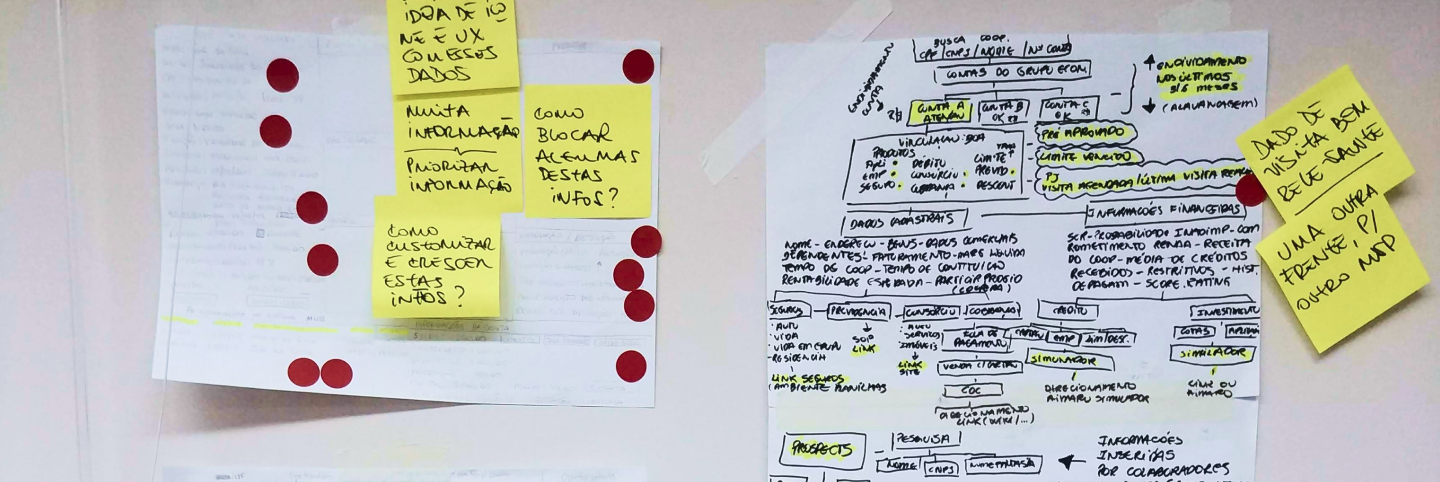
I used mapping to understand the scenario, the people involved in the service experience, and how they interact with each other.
Main Problem
Cooperative information separated in different systems.
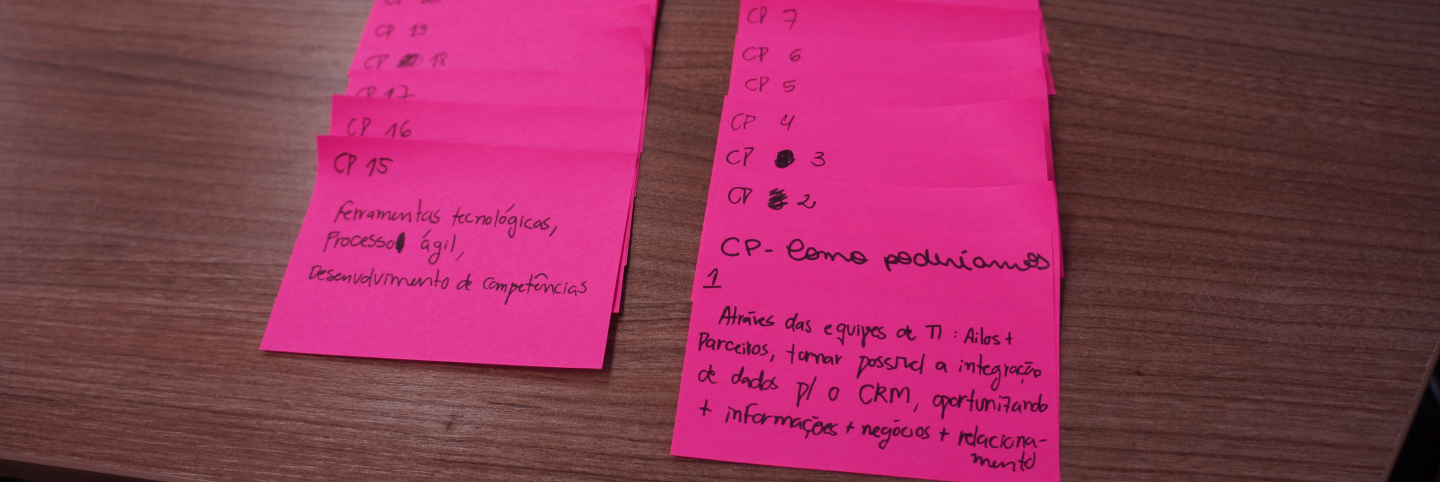
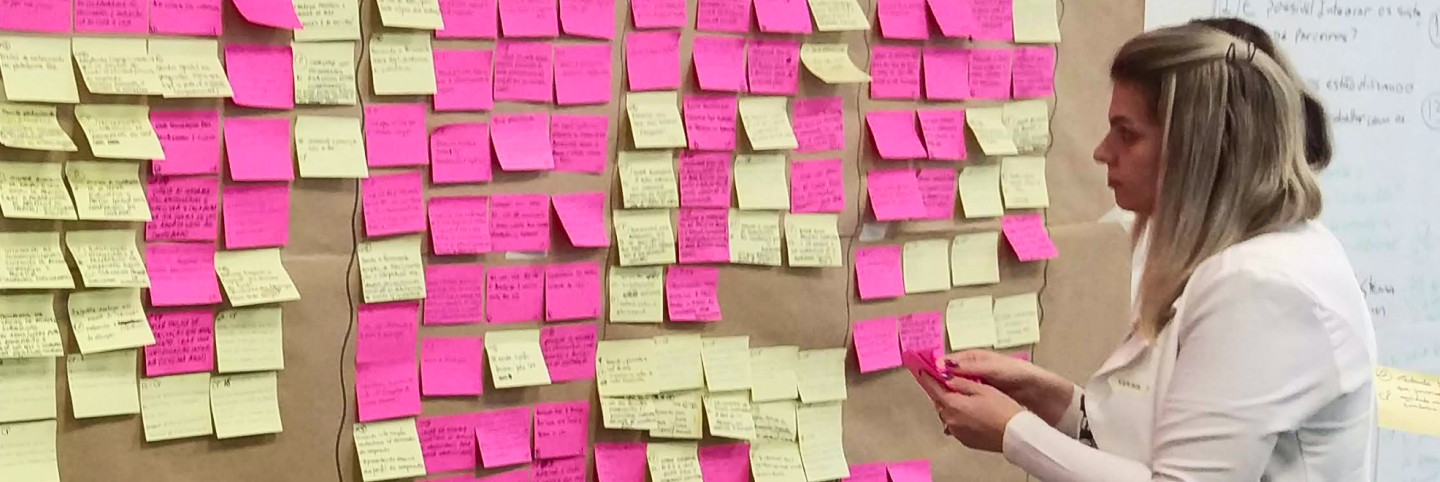
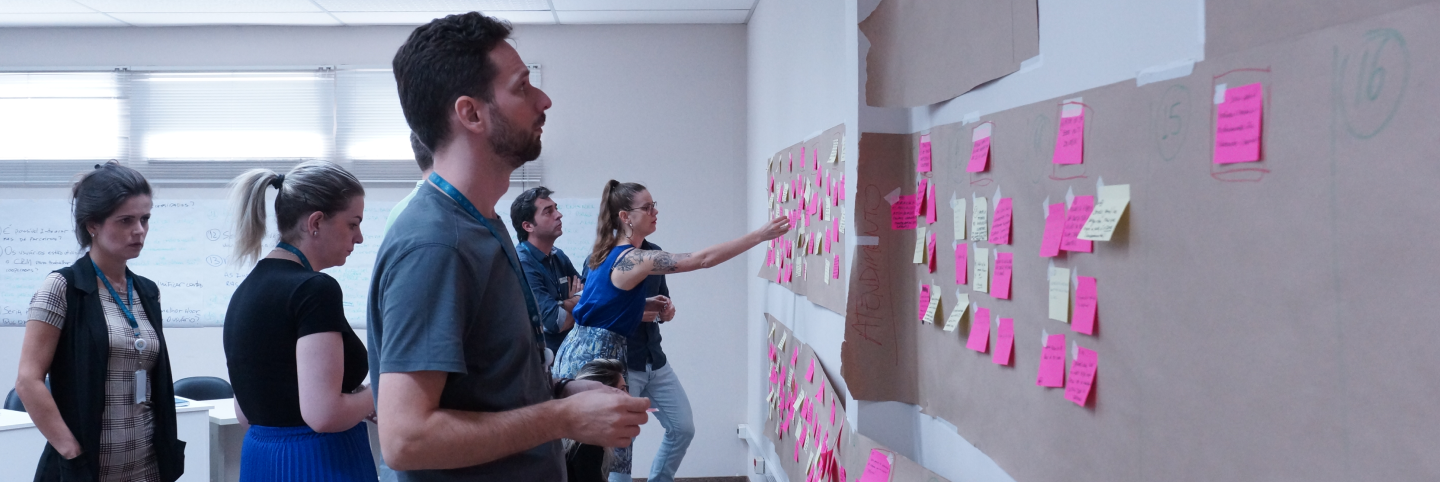
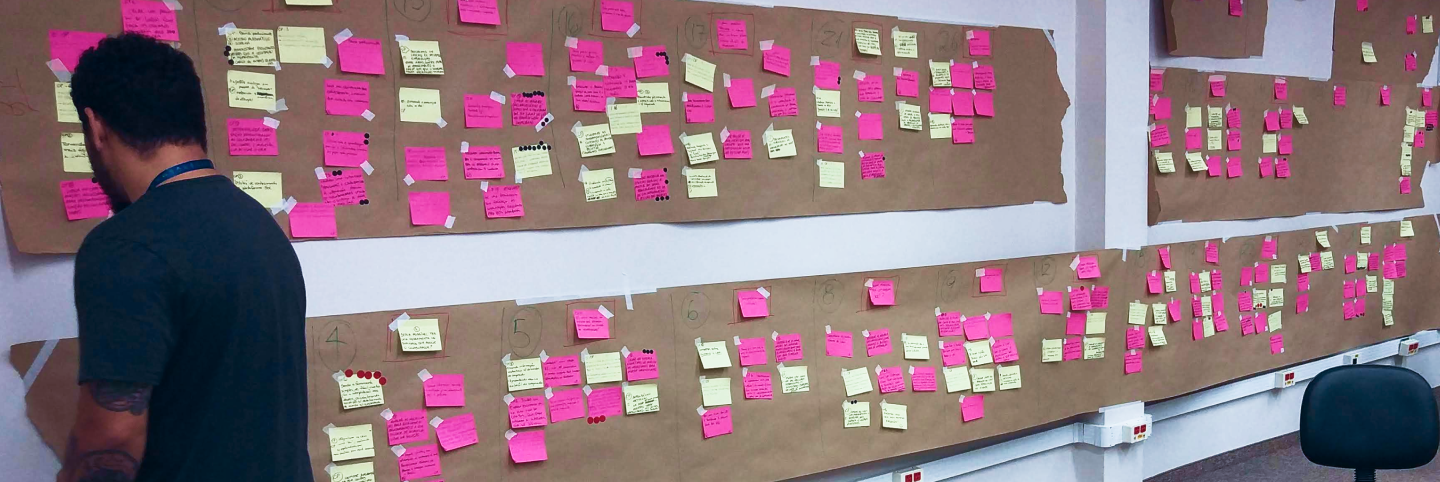
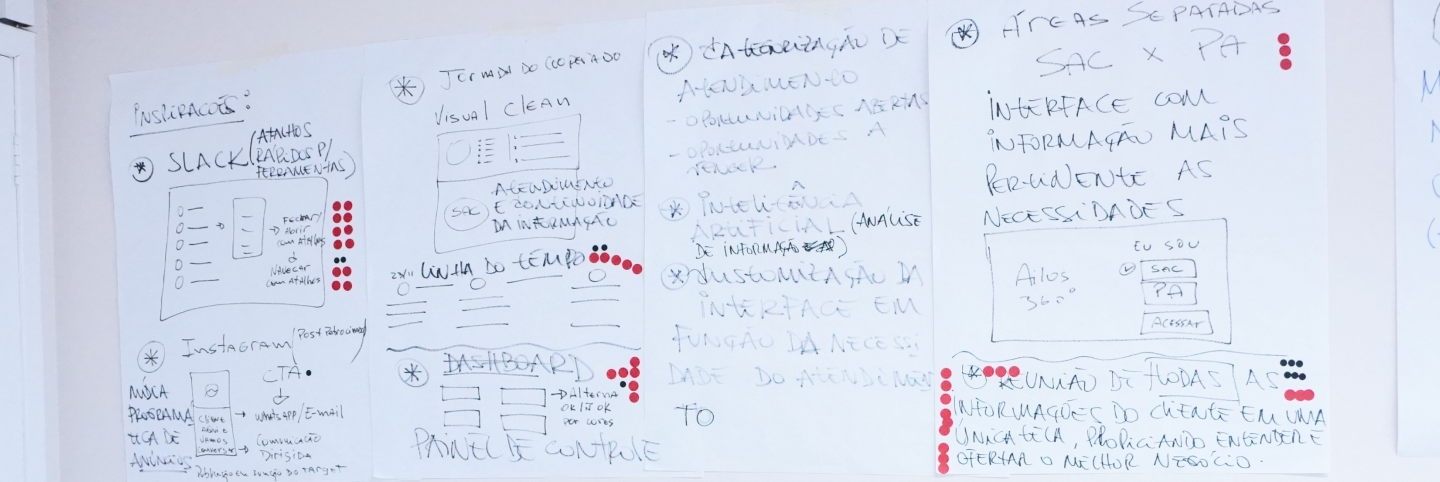
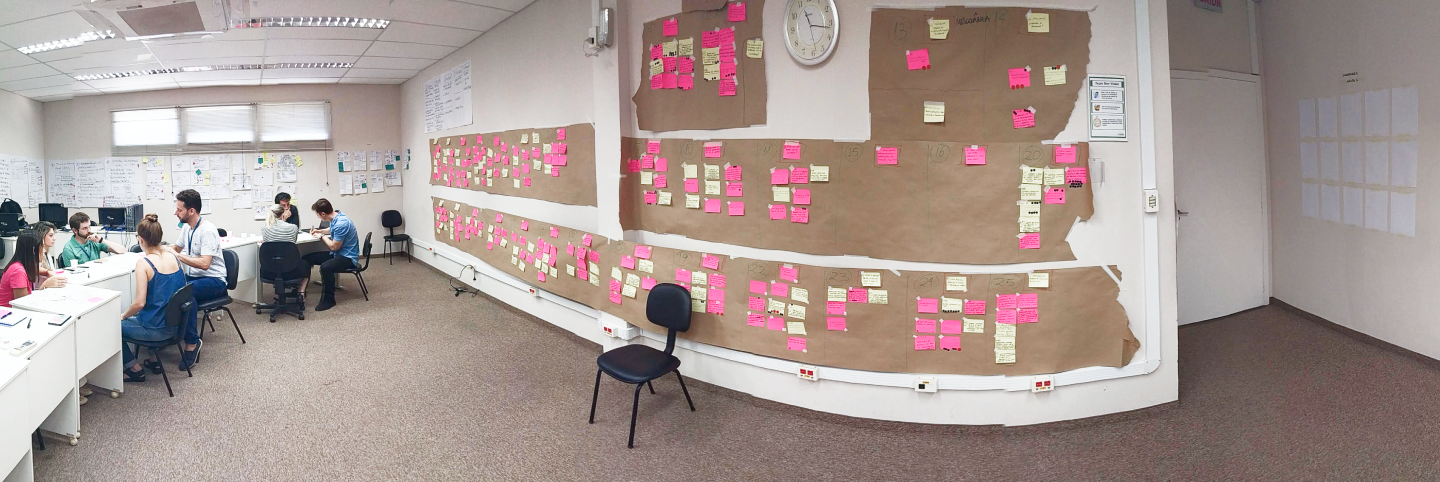
Opportunities
After interviewing stakeholders, the team listed the most critical points in the journey and came up with questions that needed answers by the end of the week. These opportunities would then drive solutions to be built and tested.
Below are the main opportunities:
• Integrate partner systems
• Know if users are using the CRM tool to serve the members
• Educate the employee on the use of CRM
• Have a quality tool that helps the cooperative member
• Have a system that offers opportunities based on need
• Have a unified registry
• Understand the necessary knowledge level of the cooperative member
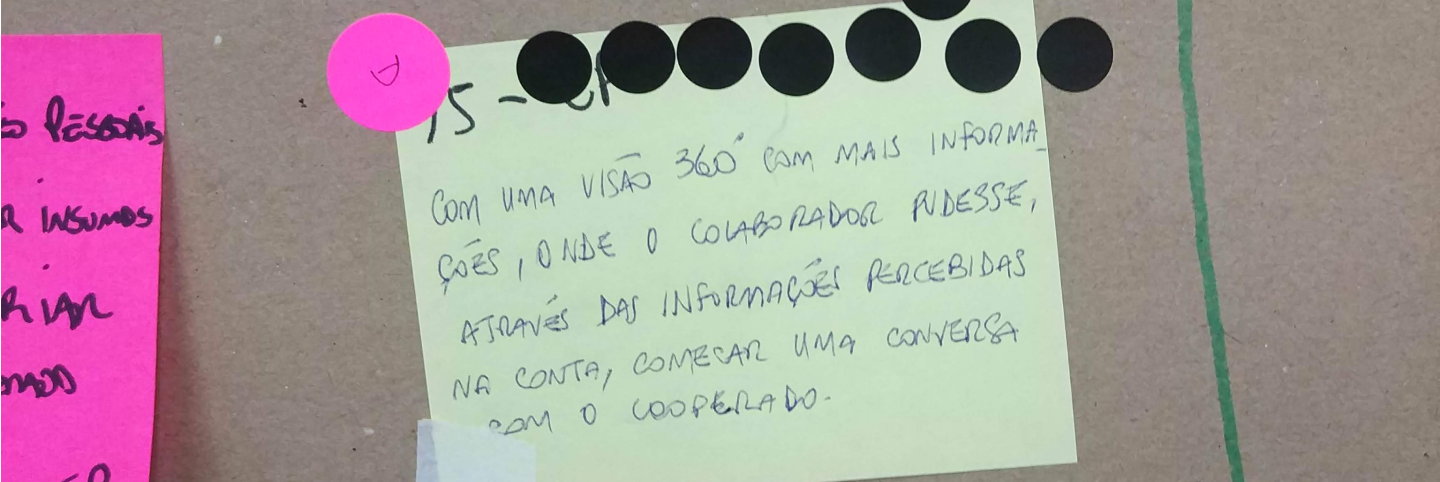
• Have a 360 degrees system
• Merge accounts by CPF
• Strategy to identify the member
• Create a more agile system
• Have all the member's necessary data
• Annoy competitors
• Improve the experience and relationship between employee and cooperative member
• Improve the cooperative's life using data
• Train the service team to get to know in-depth the different profiles of the members
• Customize the system to have closer contact with the member
• Have an alert area with important data so that the service experience is unique
• Improve the coop member's participation
• Show the cooperative member's commitment to offer better products
• Advance technologically (hardware and software)
• Understand the member's situation (e.g. why aren't you using your credit card?)
• Visualize the binding fluctuation of coop members
• Overcome technological difficulties
• Optimize internal project development processes and enable the delivery of the new system
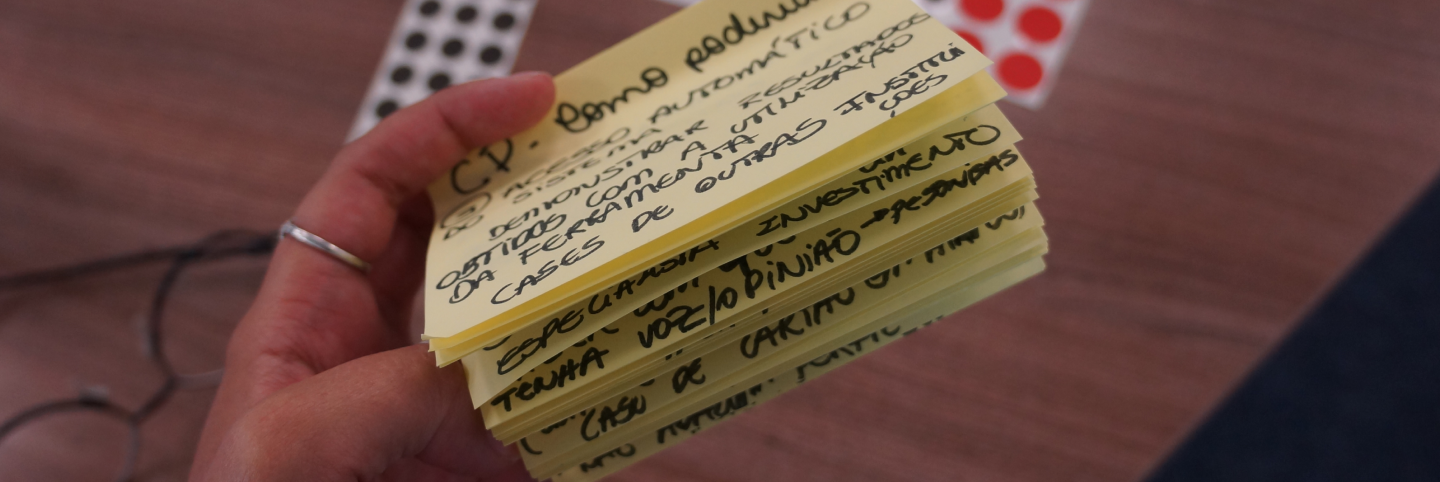
Ideation | How Might We
The “How Might We” or HMW method is an essential Design Sprint methodology.
We used it to capture opportunities during lightning talks and throughout the discovery phase.
This method allows the team to take the insights and pain points they hear and positively reframe them.
Figma Jam's whiteboard link:


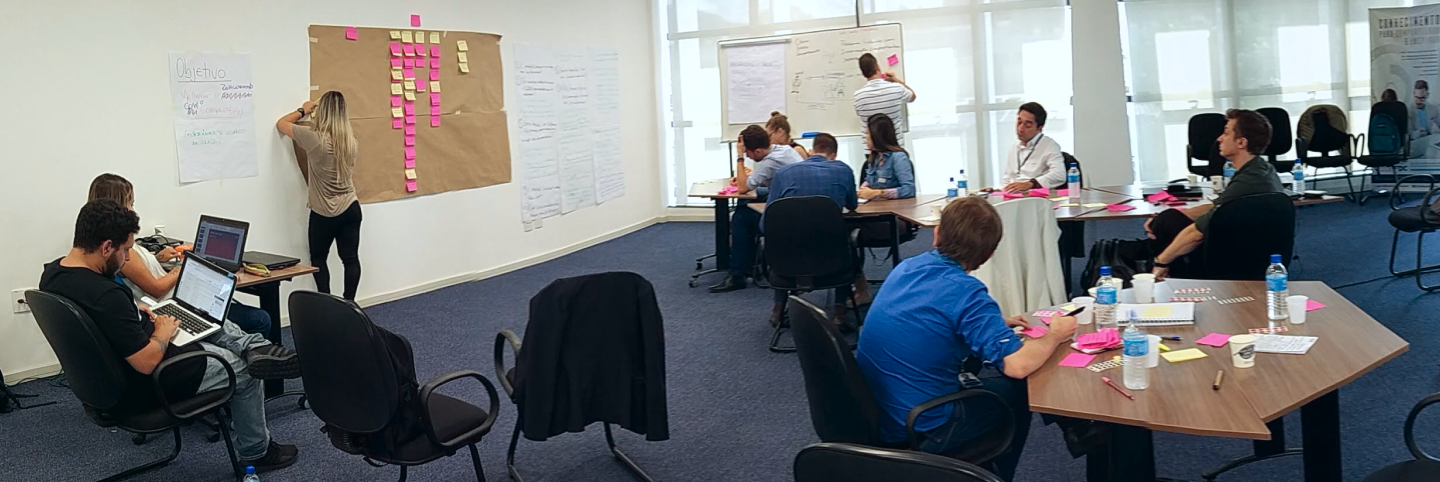
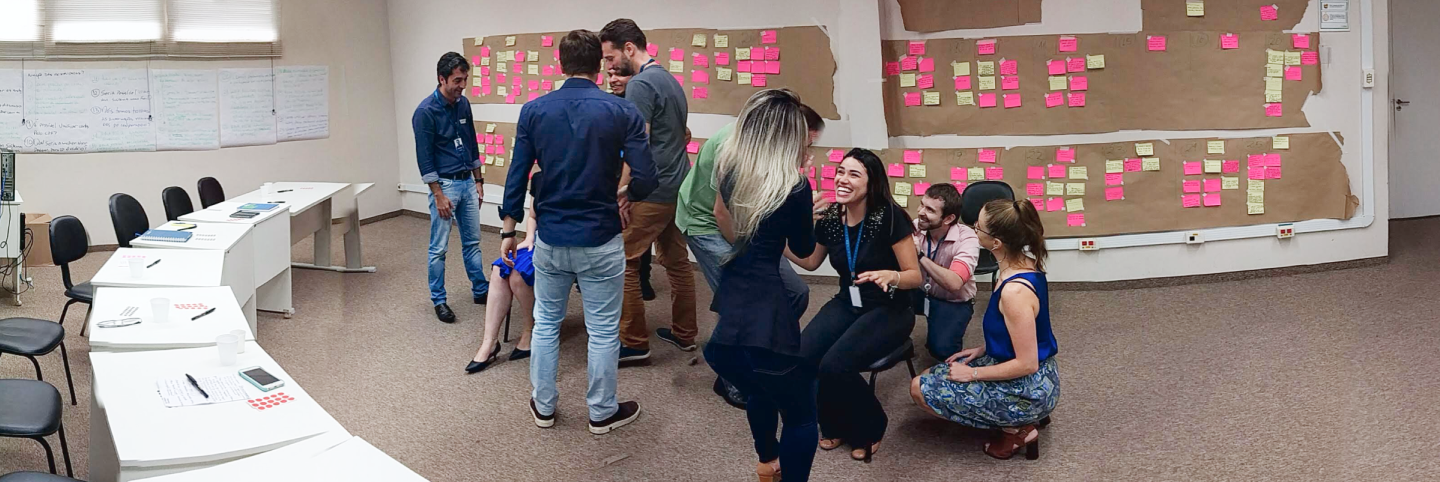

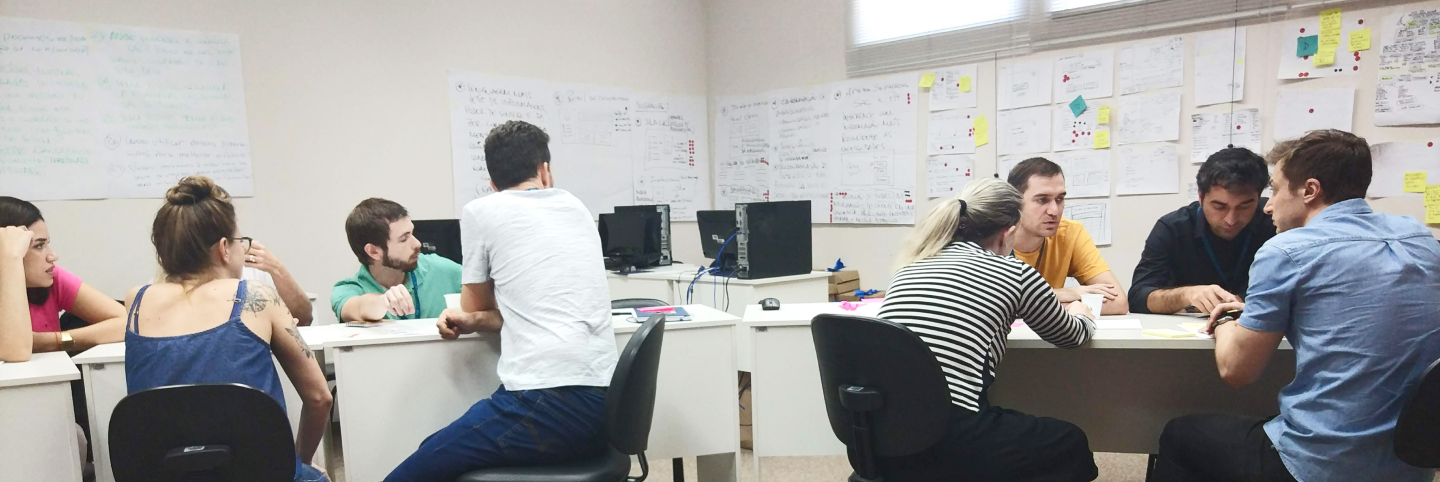
Phase 3 and 4 | Sketch and Decide
Benchmarking
The Comparable Problem method is a great warm-up for the Sketch phase of the Design Sprint. Sometimes the best ideas already exist—they simply need to be repurposed, presented in a new context, or combined with other ideas. We asked team members to research industries, related to or in parallel to their project, and to review similar business problems and their solutions. This was assigned as homework at the end of the Understand phase and completed during the Sketch phase.
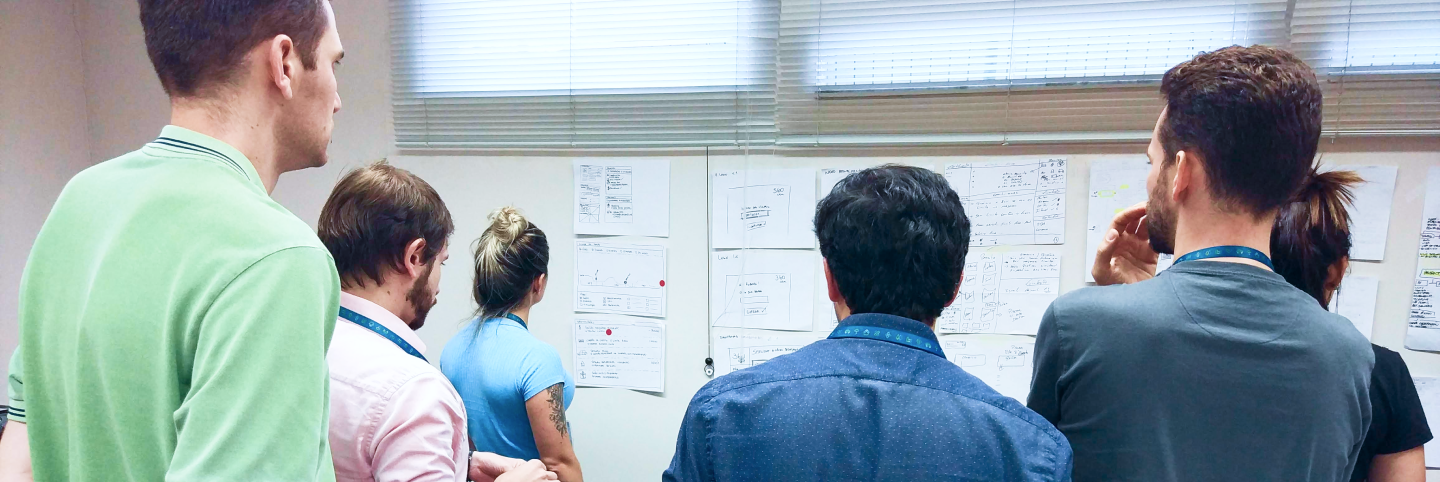
After the entire team presented their benchmark, I held a round of voting.
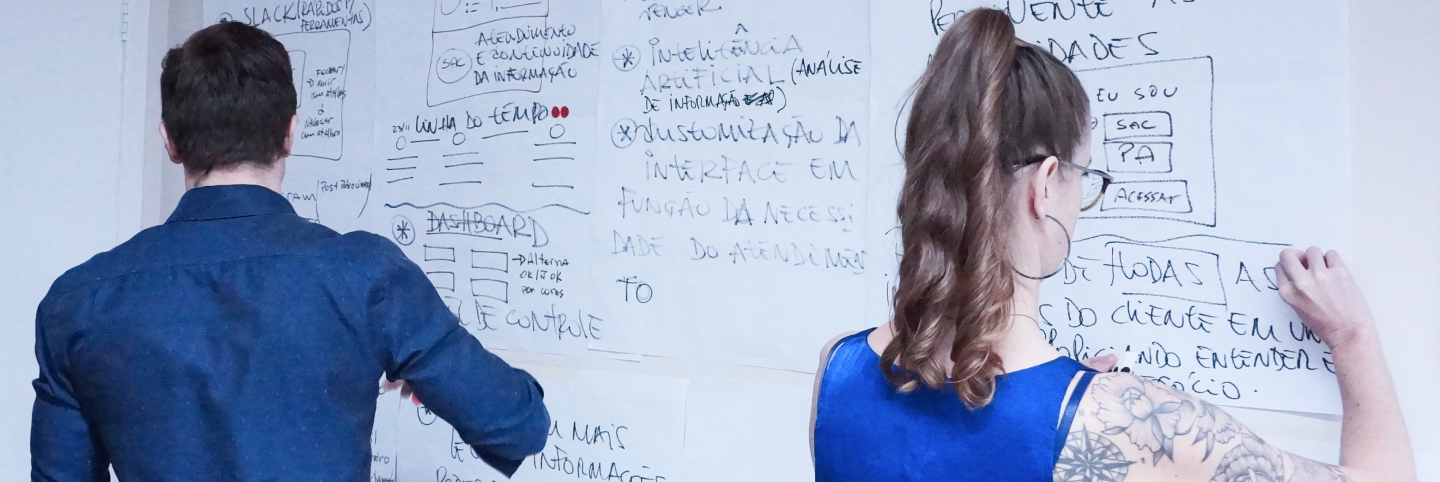
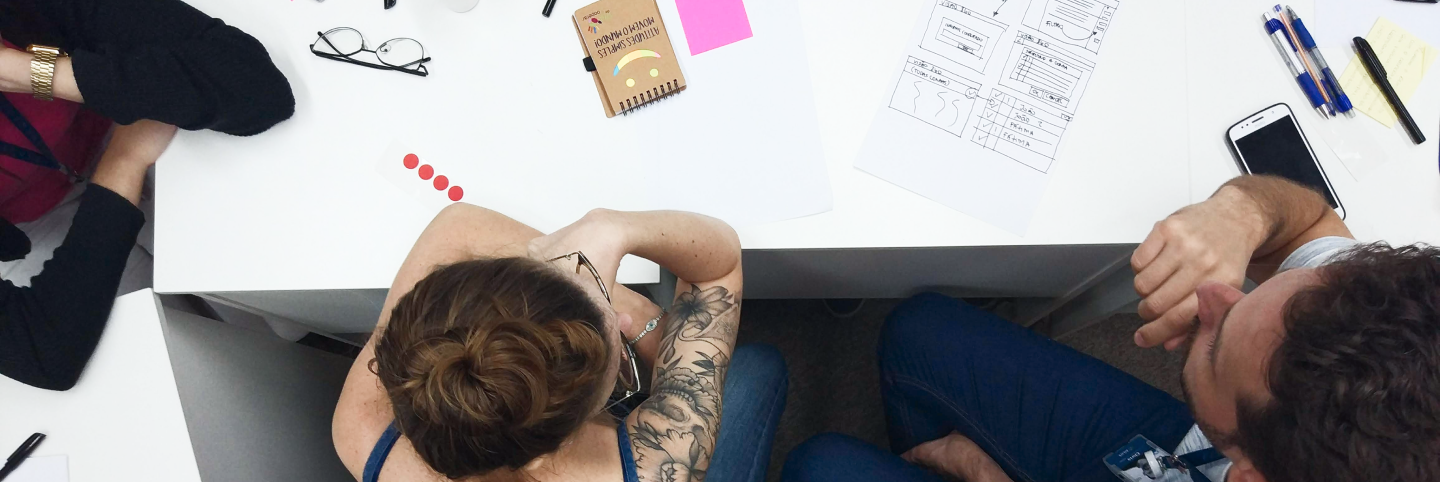
Sketches
In the Sketch phase, the Design Sprint team generated and shared a broad range of ideas as individuals. We looked for inspiration, such as solutions in alternative spaces. Then, each Design Sprint participant individually generated ideas for consideration. From there, the team narrowed ideas down from groups to a single, well-articulated Solution Sketch per person.
After the entire team presented their sketches, I held a round of voting.
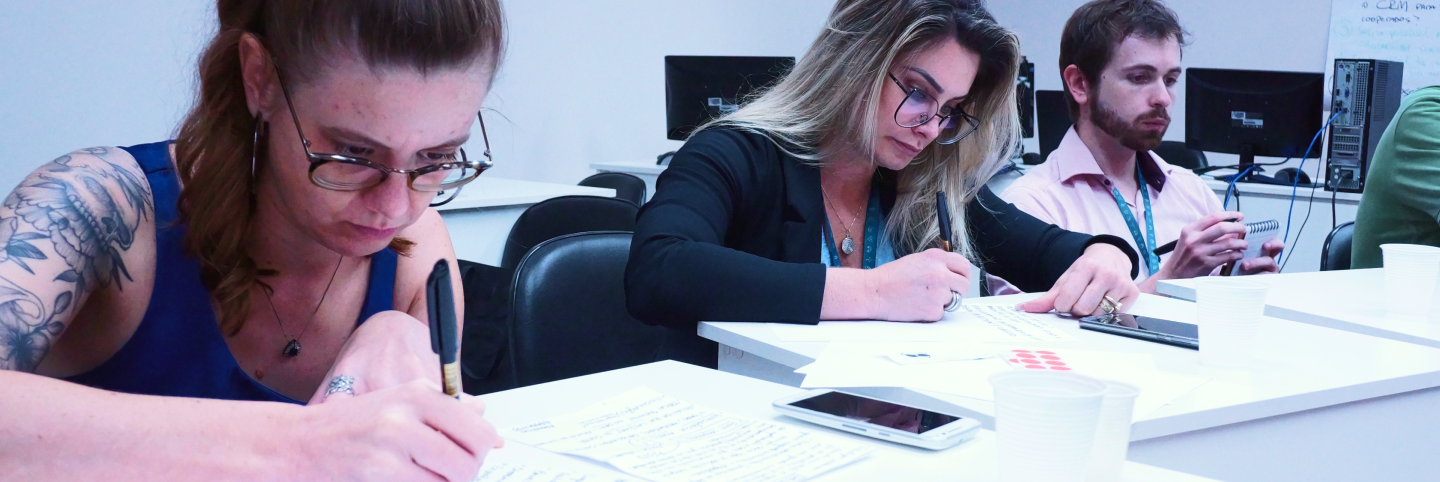
Crazy8
Crazy 8’s is a core Design Sprint method. It is a fast sketching exercise that challenges people to sketch eight distinct ideas in eight minutes.
The goal is to push beyond the first idea, frequently the least innovative, and to generate a wide variety of solutions to the challenge.
After everyone had finished the Crazy 8’s exercise, each team member quickly shared the ideas they had generated and discussed them with the group.
After the entire team presented their sketches, I held a round of voting. Here we hadn’t chosen the idea yet; we were just moving forward. We were weeding out any sketches that weren’t feasible and/or wouldn’t help the user.
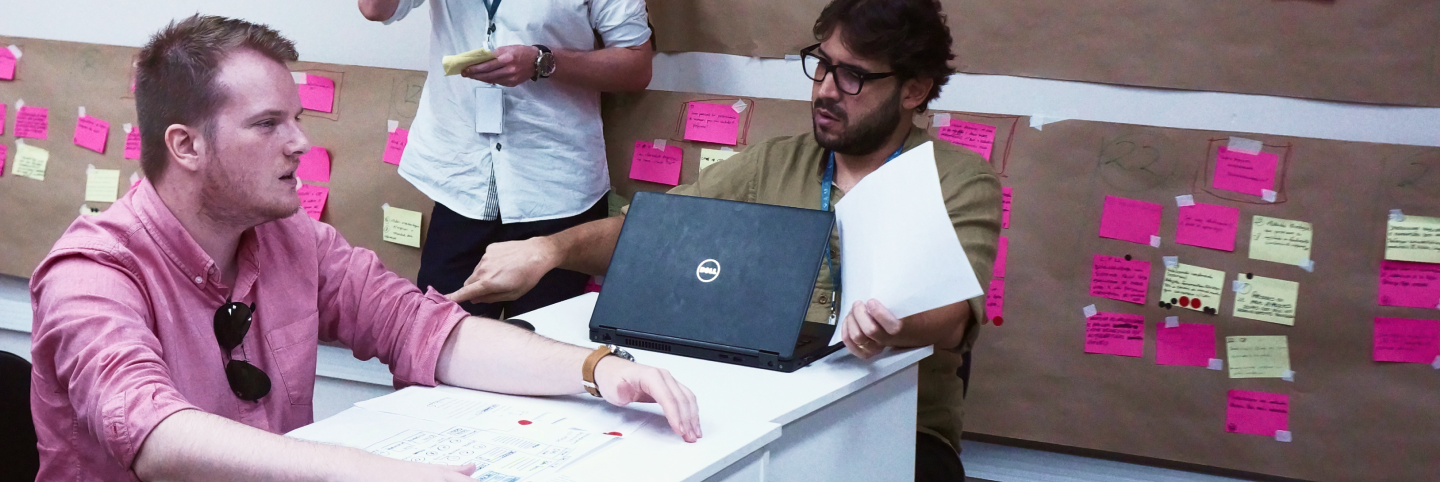
Phase 5 | Prototype
Storyboard
The Storyboard method unified the entire Design Sprint team on the prototype concept and helped the group to make critical decisions during the prototyping process. Using a Storyboard helped us to map out each step of the experience. It clarified the pieces the team needed for the prototype.
Script writing was important at this stage as it helped align the storyboard to the user interview and clarified the structure of what mocks or experiences would be needed in the testing. The script also helped us create a plan for the Validate phase.
Strategy to structure the teams:
We were divided into two groups of 5 people in order for the tasks to be completed more efficiently.
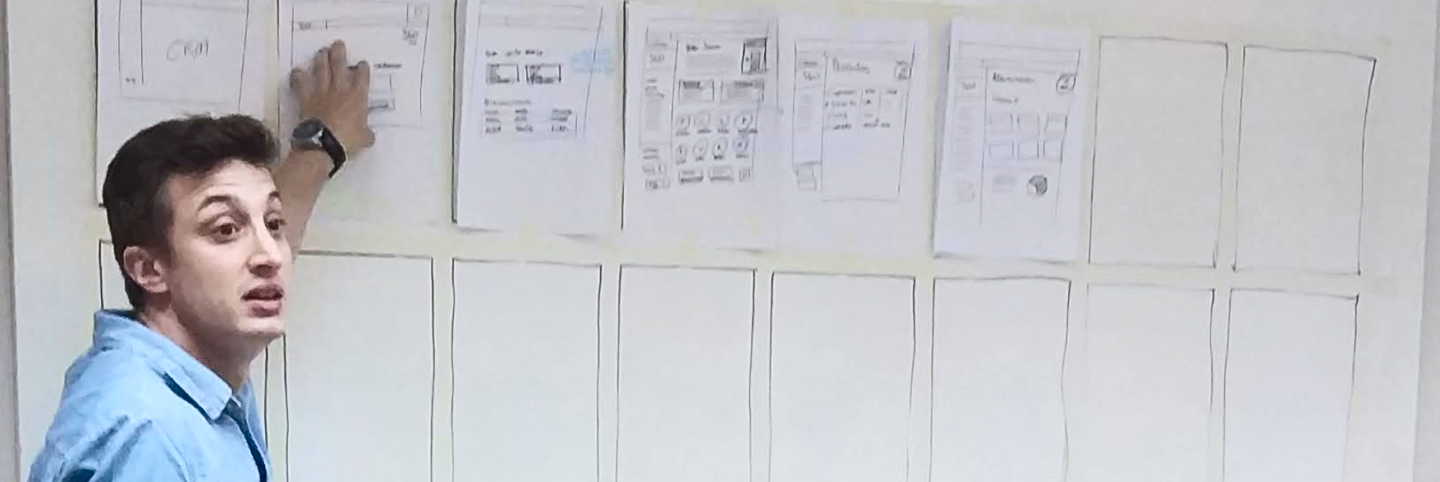
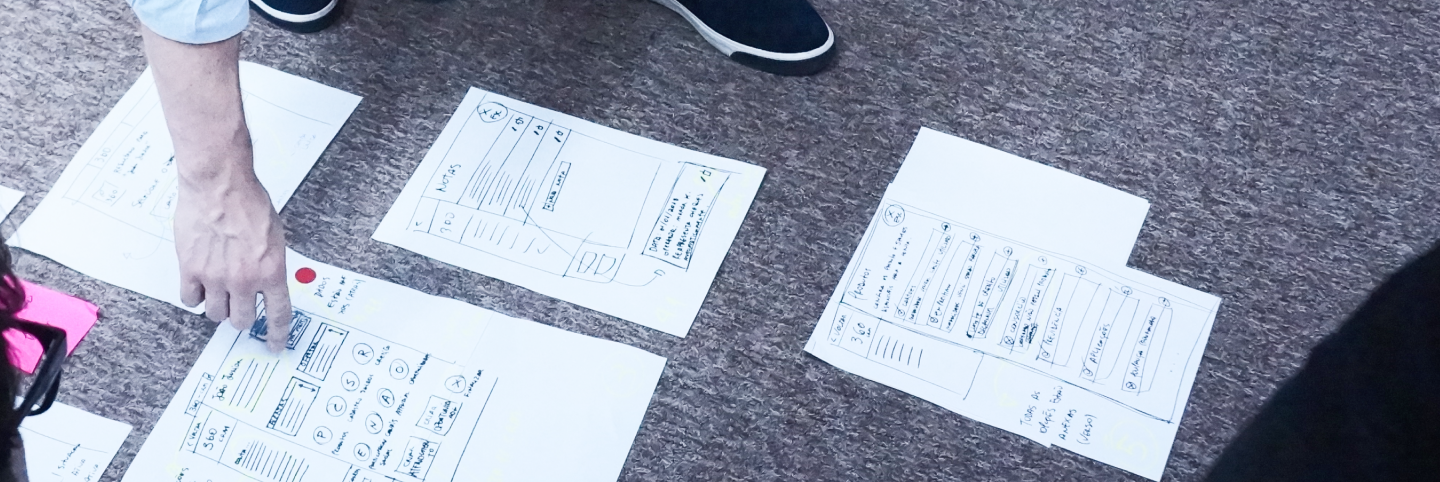
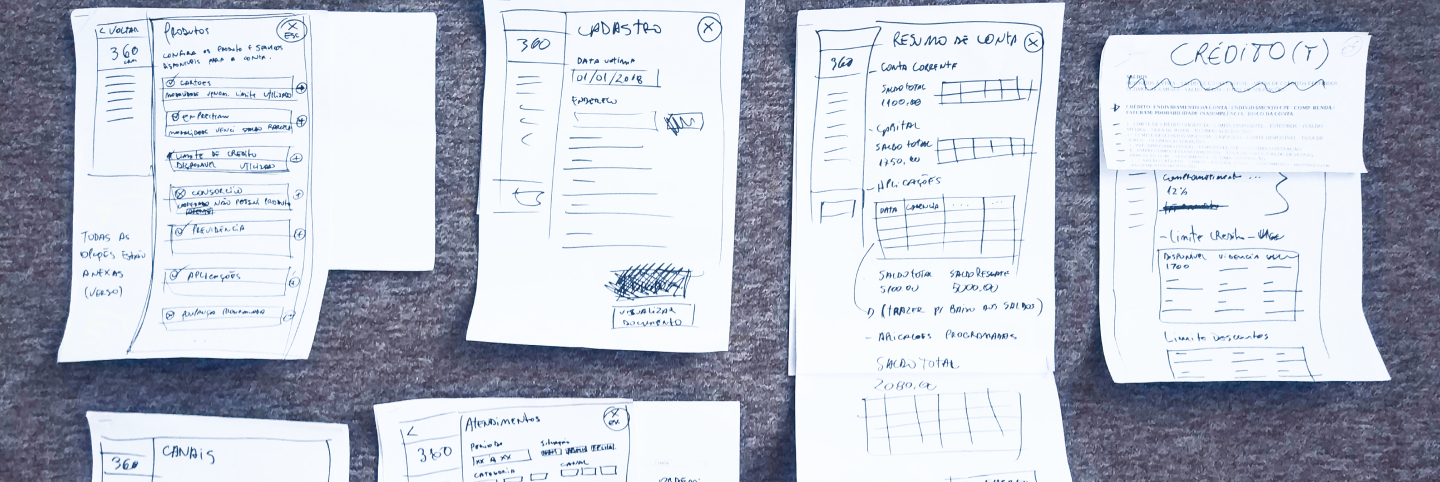
Low Fidelity Prototype
In the most basic form paper prototypes are drawings of websites on paper.
These can be extremely rough in execution. The drawings don’t have to look good, they just need to convey an idea. The primary benefit of paper prototyping is speed. This practice can reduce the time it takes to design in multiple areas.
With paper prototyping we simulated usability tests before anything had been designed or built. We simply found a test subject and had them mock interact with the interface, indicating what they clicked and talking about their thought process. We were able to get the same level of insight without having to wait until changes became expensive. Additionally, we were able to sketch a new interface on the spot and re-run the test to validate our new solution.
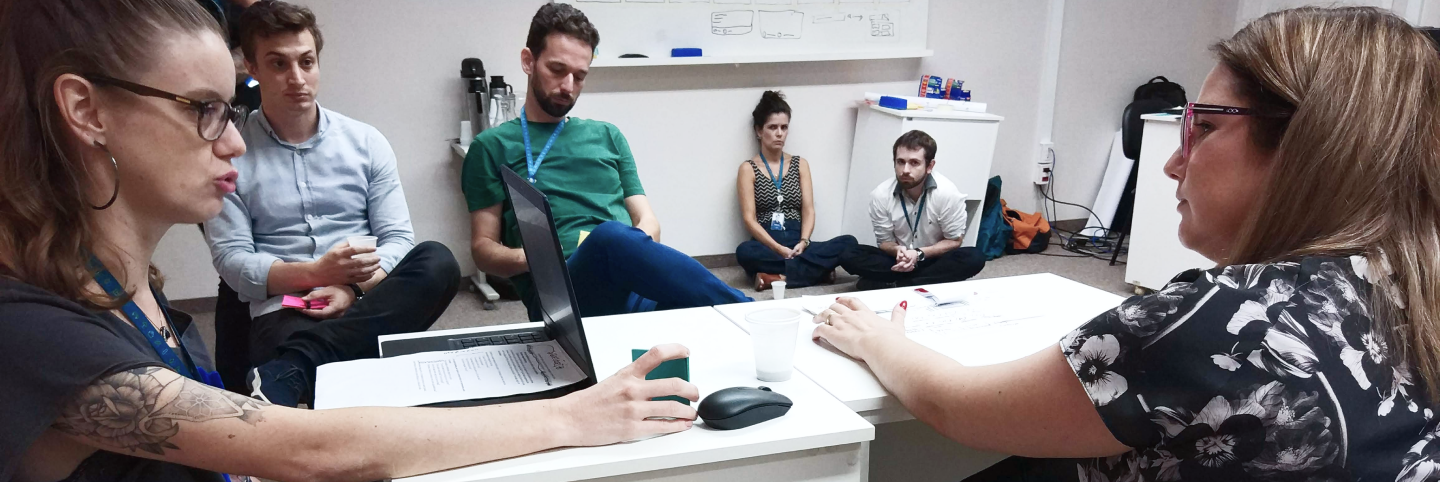
Phase 6 | Validate
Pilot User Testing
We tested our study script with a colleague.
After doing two mock tests, we were able to proceed to conduct the main test.
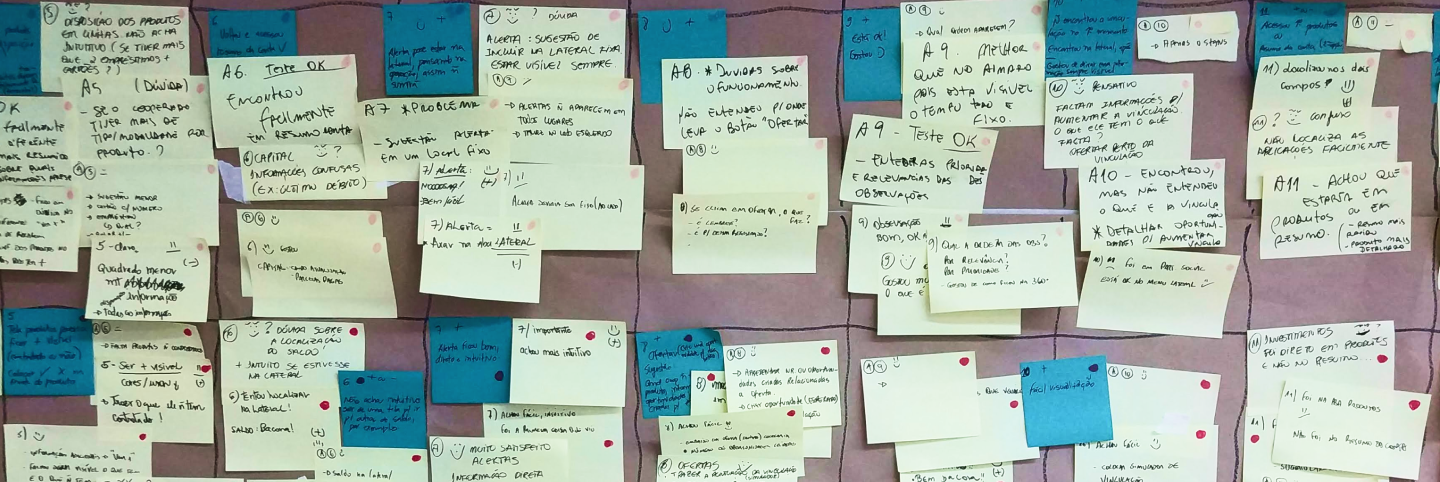
Usability Tests with real users
In the Validate phase, the Design Sprint team was able to put their concept in front of users - this was the moment of truth!
We gathered feedback from five real users who interacted with a digital prototype that we built the previous night.
Script questions in the Google Docs:
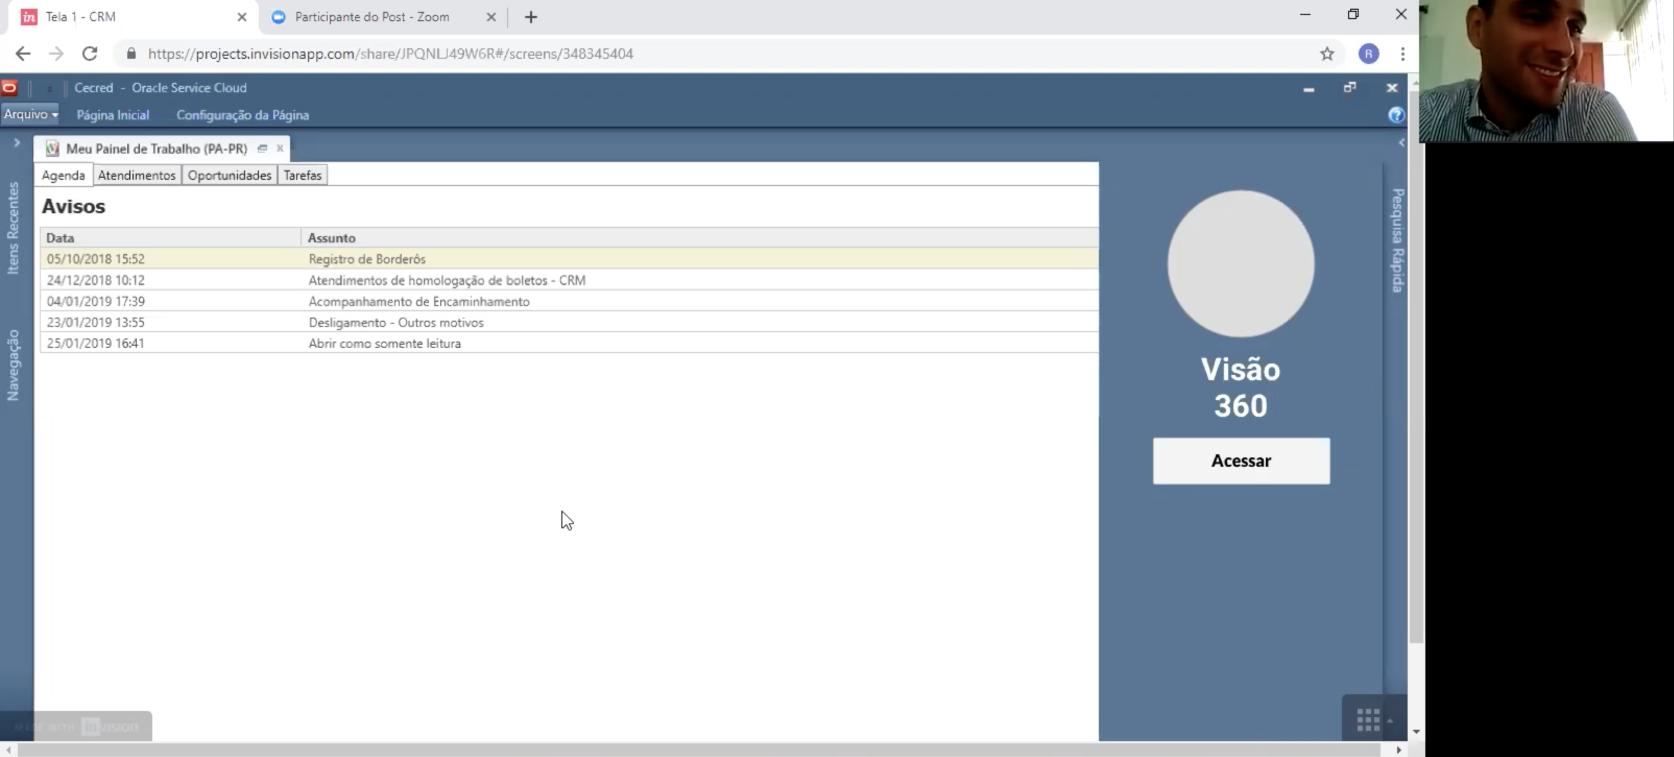

Prototype
InVision APP Prototype:
Results
We shared a Google Sheet document with all the impressions from the usability tests.
Goal | Keep in Mind
Improve the relationship with the cooperative.
User tasks analysis:
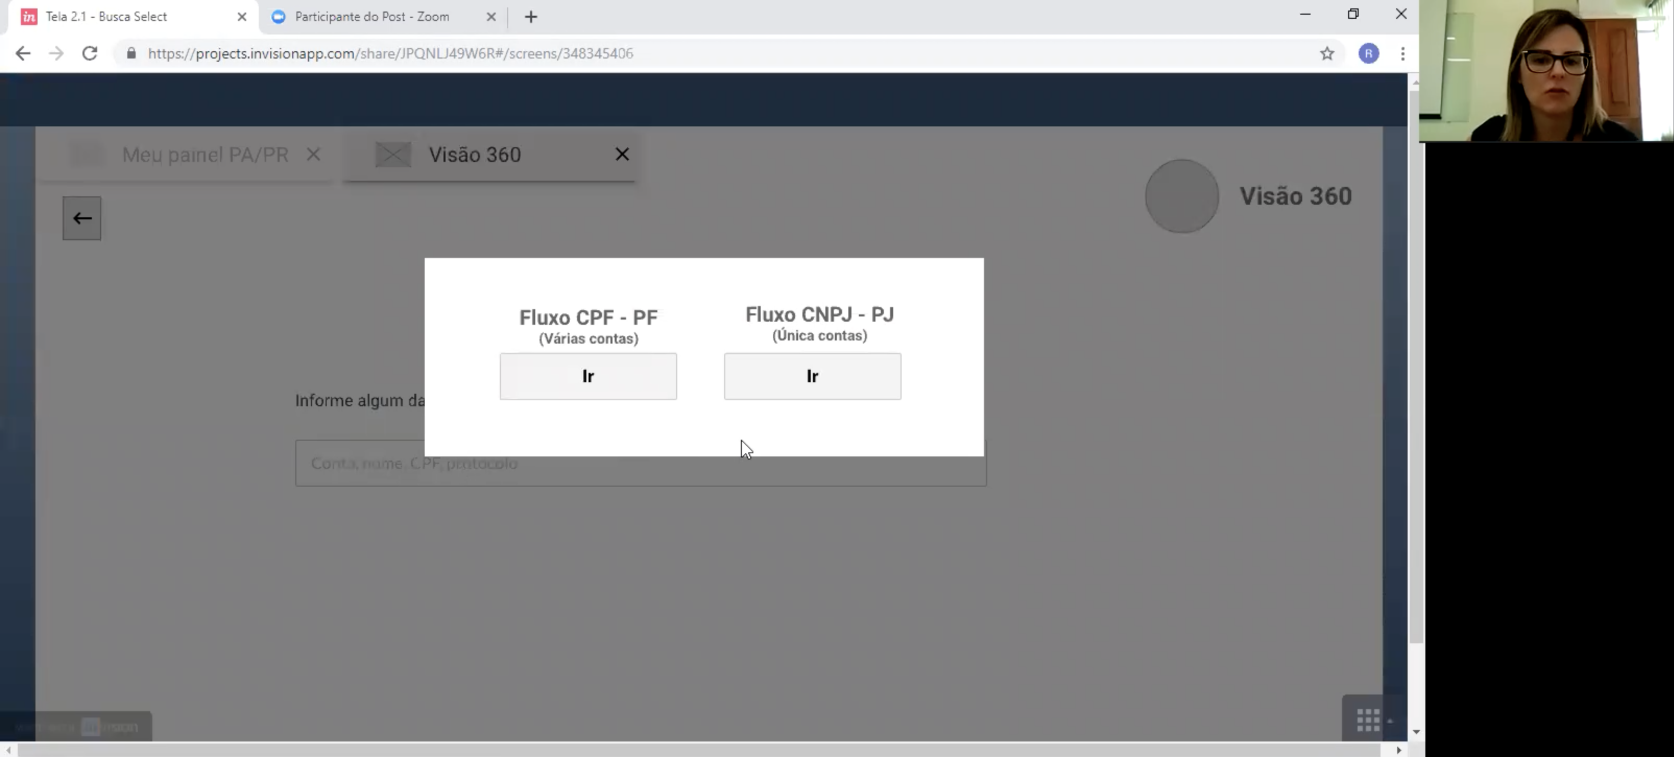
1. Look for a coop member using the CPF
• 6 of 6 users completed the task successfully
2. Identify how many services the coop member already had for each of their accounts
• 6 of 6 users completed the task successfully
3. Identify how many opportunities the coop member already had for each of their accounts
• 6 of 6 users completed the task successfully
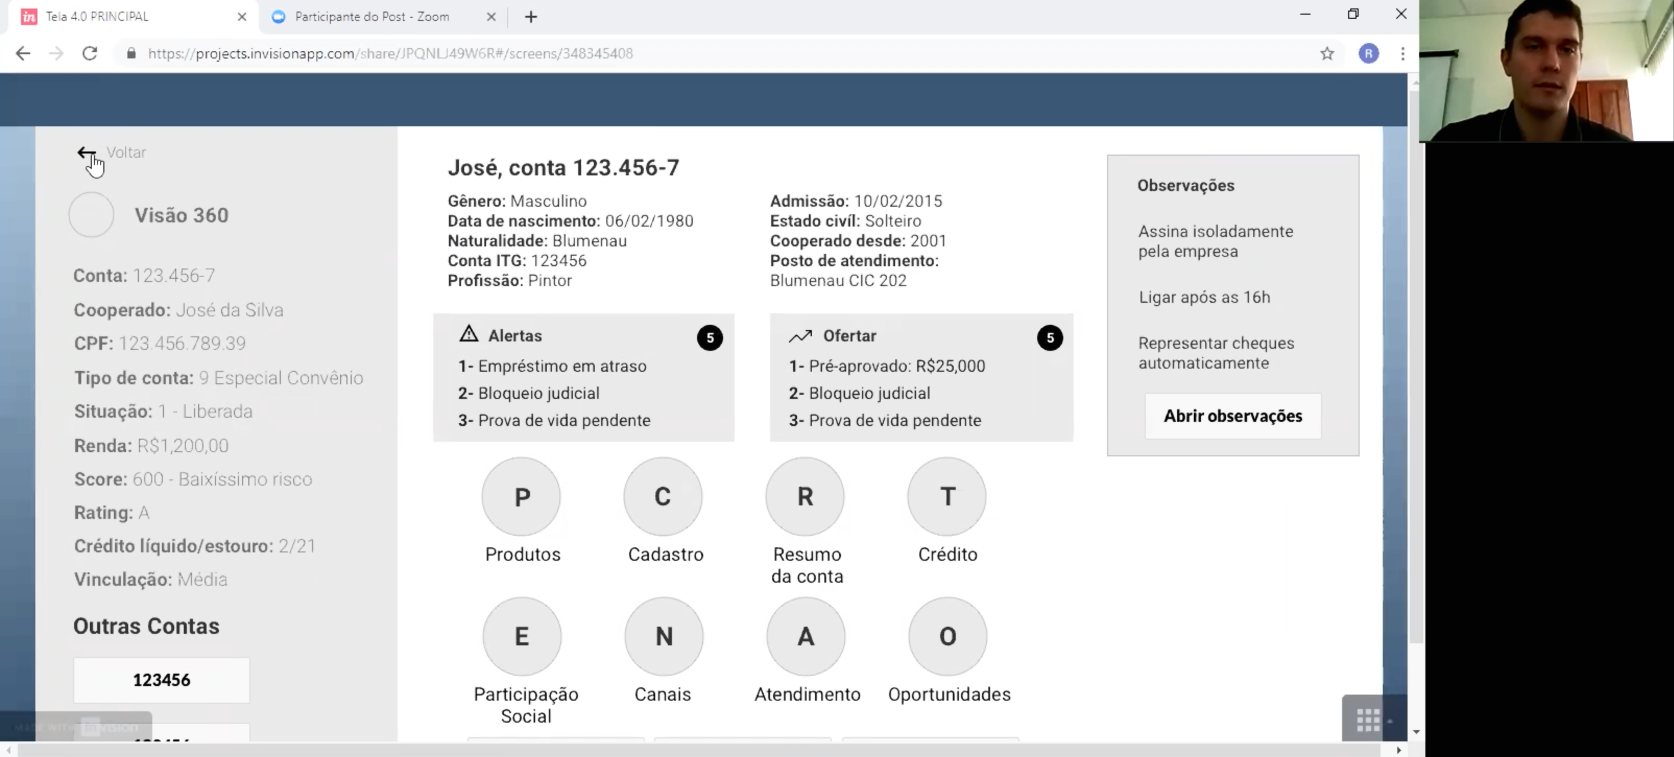
4. Access the coop member account
• 5 of 6 users completed the task successfully
• 1 of 6 users completed the task with some difficulty
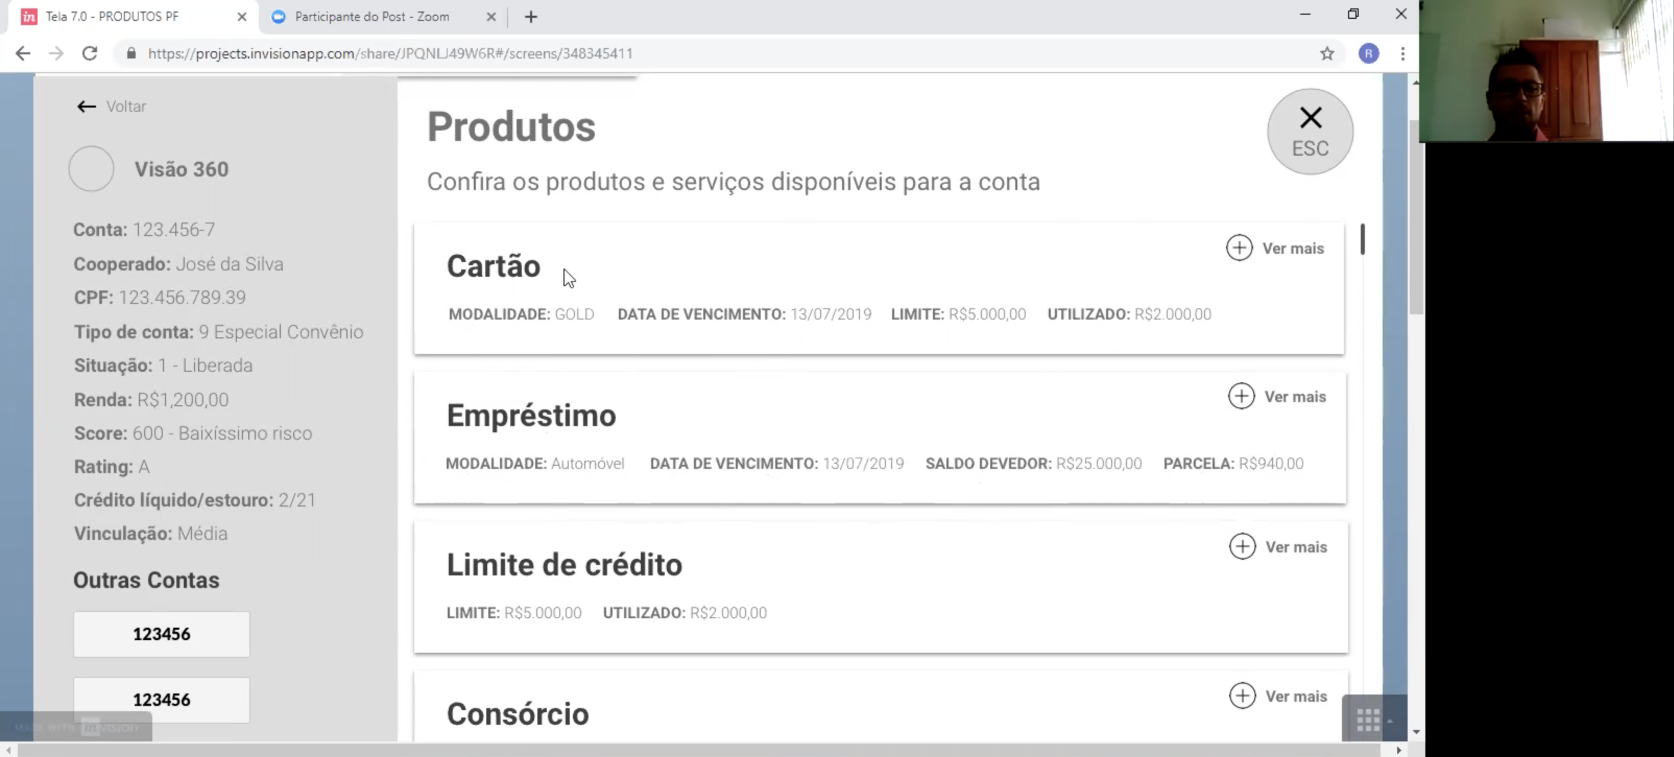
5. Verify which products the coop member has in their account
• 6 of 6 users completed the task successfully
6. Check the account balance
• 4 of 6 users completed the task successfully
• 2 of 6 users completed the task with some difficulty
7. Identify account alerts
• 5 of 6 users completed the task successfully
• 1 of 6 users didn’t complete the task
8. Verify if there are possible offers for the coop member
• 5 of 6 users completed the task successfully
• 1 of 6 users didn’t complete the task
9. Verify the account notes
• 5 of 6 users completed the task successfully
• 1 of 6 users didn’t complete the task
10. Identify the account link
• 5 of 6 users completed the task successfully
• 1 of 6 users completed the task with some difficulty
11. Check the account investments
• 5 of 6 users completed the task successfully
• 1 of 6 users didn’t complete the task
12. Verify the 360 dregree views of the coop member’s additional accounts
• 5 of 6 users completed the task successfully
• 1 of 6 users completed the task with some difficulty
13. Create a service
• 6 of 6 users completed the task successfully
The result of the usability tests was positive.
• 100% of users were satisfied with the product designed
• 84% of users completed the tasks successfully
• 87% of tasks were done in a short time (less than one minute)
• 77% of the tasks had no heuristics (interface) problems
Google Sheet - Tabulate the data analysis: